Pages

Showing posts with label London. Show all posts

Thursday, 19 November 2015

Mapping Protest in 3D with Twitter Data


As one part of my docotoral thesis, I have made the video that shows the relationship between ‘London End Austerity Now’ Protest on 20th June 2015 and the Twitter acitivity on that day.
The video gives you some details about the protest, the data and 3D visualisation.
If the following YouTube video is not displayed on your device, please use this link. 


Thursday, 10 September 2015

Mapping London’s Twitter Activity in 3d


Image 1. The tweet density from 8am to 4pm on 20th June 2015, Central London


Twitter Mapping is increasingly useful method to link virtual activities and geographical space. Geo-tagged data attached to tweets containing the users’ location where they tweeted and it can visualise the locations of users on the map. Although the number of the geo-tagged tweets is a relatively small portion of all tweets, we can figure out the density, spatial patterns and other invisible relationships between online and offline.

Recently, studies with geo-tagged tweets have been developed to analyse the public response to specific urban events, natural disasters and regional characteristics (Li et al., 2013) [1].  Furthermore, it is extending to traditional urban research topics, for example, revealing spatial segregation and inequality in cities (Shelton et al., 2015) [2].
 
Twitter mapping in 3D can augment 2d visualisation by providing built environment contexts and improved information. There are many examples of Twitter mapping in 3d such as A) #interactive/Andes [3] , B) London’s Twitter Island [4], C) Mapping London in real time, using Tweets [5]. A) and B) build up 3d mountains of the geo-tagged tweet on the map.  In the case of C), when the geo-tagged tweets are sent in the city, the heights of nearest buildings increase in the 3d model. These examples are creative and show different ways to view the integrated environments.


From a Networking City’s view, if we make a Twitter visualisation more tangible in a 3d urban model, it would help us to have a better understanding how urban environments are interconnected with the invisible media flow.
 
To make the visualisation, the Twitter data has been collected by using Big Data Toolkit developed by Steven Gray at CASA, UCL. All 53,750 geo-tagged tweets are collected on 20th June, 2015 across the UK. As we can see from Table 1, the number of tweets was at the lowest point at 5am and reached to the highest point at 10pm with 3495 tweets. Moreover, Video 1 shows the location of the data in the UK and London on that day in real time.


Table 1. The Number of Geo-Coded Tweets in the UK on 20th June, 2015
 

https://www.youtube.com/watch?v=dg-2VlVfFaM


Video 1. The location of Geo-Coded Tweets in the UK on 20th June, 2015


When we calculate the density of the data, London, particularly Central London, contains the largest number of the tweets. (Image 2)


Image 2. The density of Geo-Coded Tweets in the UK on 20th June, 2015


In order to focus on the high density data, 6 km x 3.5 km area of Central London is chosen for the 3d model. Buildings, bridges, roads and other natural environments of the part of London have been set in the model based on OS Building Heights data[6]. Some Google 3d warehouse buildings are added to represent important landmark buildings like St.Pauls, London Eye and Tower Bridge as you can see from Image 3, Image 4 and Image 5.


Image 3. The plan view of Central London model


Image 4. The perspective view of Central London model


Image 5. The perspective view of Central London model (view from BT Tower)


The geo-tagged data set is divided into one hour periods and distributed on the map to identify the tweet density in the area. Through this process, we can see how the density is changing depending on the time period. For example, the tweets are mainly concentrated around Piccadilly Circus and Trafalgar Square between 10am and 11am, but  there are two high-density areas between 12pm and 1pm (See Image 6, Image 7, Image 8 and Image 9)


Image 6. The tweet density between 10am and 11am on 20th June 2015


Image 7. The tweet density between 12pm and 1pm on 20th June 2015


Image 8. The tweet density from 12am to 12pm


Image 9. The tweet density from 12pm to Midnight


As we’ve seen above, the 2d mapping is useful to understand the relative density in one period such as which area is high and which area is low between 12pm and 1pm. However, we cannot understand the degree of intensity in the highest peak areas. It is believed that 3d mapping is needed at this stage. We can clearly see the density of the tweet data in each period and the intensity of the tweet density across the time periods from Image 10 to Image 14.
West End area shows high density throughout the whole day but City area shows the peak only during lunch time. This pattern likely relates to the activities of office workers in City and leisure/tourist in West End.


Image 10. The tweet density in 3d between 10am and 11am on 20th June 2015


Image 11. The tweet density in 3d between 12pm and 1pm on 20th June 2015
 

Image 12. The tweet density in 3d from 12am to 8pm


Image 13. The tweet density in 3d from 8am to 4pm


Image 14. The tweet density from 4pm to Midnight


 ________________________________________


[1] Linna Li , Michael F. Goodchild & Bo Xu (2013) Spatial, temporal, and socioeconomic patterns in the use of Twitter and Flickr, Cartography and Geographic Information Science, 40:2, 61-77

 
[2] Taylor Shelton, Ate Poorthuis & Matthew Zook (2015) Social Media and the City: Rethinking Urban Socio-Spatial Inequality Using User-Generated Geographic Information, Landscape and Urban Planning (Forthcoming), http://papers.ssrn.com/abstract=2571757

 
[3] Nicolas Belmonte, #interactive/Andes,   http://twitter.github.io/interactive/andes/  (Strived on 15th August 2015)

 
[4] Andy Hudson-Smith, London’s Twitter Island – From ArcGIS to Max to Lumion, http://www.digitalurban.org/2012/01/londons-twitter-island-from-arcgis-to.html#comment-7314
(Strived on 15th August 2015)

 
[5] Stephan Hugel and Flora Roumpani, Mapping London in real time, using Tweets, https://www.youtube.com/watch?feature=player_embedded&v=3fk_qxGZWFQ  (Strived on 15th August 2015)


[6] OS Building Heights-Digimap Home Page  http://digimap.edina.ac.uk/webhelp/os/data_information/os_products/os_building_heights.htm  (Strived on 15th August 2015)


Saturday, 23 March 2013

Having a lunch at Duck and Waffle, Heron Tower in London

Looking at Heron Tower on the street (The image is taken by Networking City)

Some days ago, I went to Heron Tower near Liverpool Street Station in London.
This 46 floors and 230meter remarkable high rise building,
which is designed by KPF with structure design by Arup, was built in 2011.
Duck & Waffle restaurant is located on the 40th floor of the building.

Looking down toward Liverpool Street (The image is taken by Networking City)

The bar on the 40th floor of Heron tower (The image is taken by Networking City)

The interior of Duck & Waffle (The image is taken by Networking City)

The ‘Duck & Waffle’ at Duck & Waffle (The image is taken by Networking City)

My friend recommended this place because I can see an incredible cityscape of London, although the menu is pricey.
Not only the beautiful scenery of London but unusual food, which is crispy fried duck and fried-egg covered a waffle with maple syrup, are there.
The interior design of the restaurant is not looking good as much as some photos on their website.
It feels like rather refined, but some materials such as yellow wave ceiling do not make a nice combination altogether.  

However, looking down 30 St Mary Axe (or Gherkin) designed by Foster and 122 Leadenhall Street (or Cheese Grater) by Rogers just beside them was a strange and exciting experience. It gives a reason to go there.

Looking at 30 St Mary Axe and 122 Leadenhall Street (The image is taken by Networking City)
I recorded a film image in a high-speed elevator of Heron Tower.
The feeling of coming down from the 40th floor to ground level by the elevator is similar to that of dreaming flying dim London air but immediately returning to desert reality.


Friday, 8 March 2013

BSP Seminar - Compact cities or garden suburbs?


Dr. Nicolas Falk presented for Bartlett School of Planning. Image is taken by Networking City

In this year, Bartlett School of Planning run BSP seminar series over the semesters. On 6 March 2013, Dr. Nicolas Falk, Director of URBED (Urbanism Environment Design), provided a presentation the title of “Compact cities or garden suburbs?” at Central House of UCL.

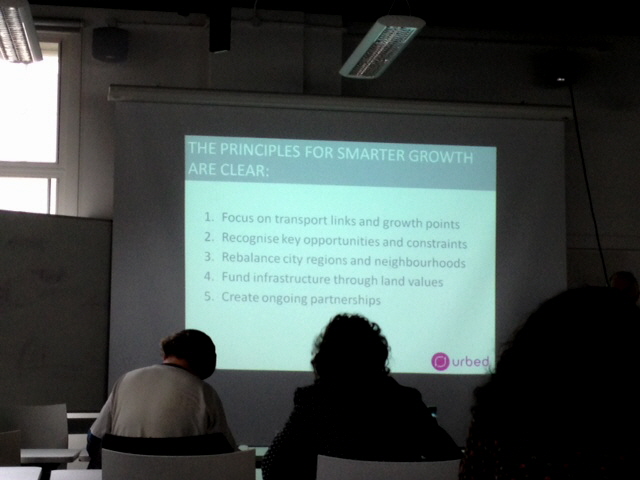
Because I was bit late, I could not watch all his presentation. He suggested simple but well-summarised planning keywords and showed relevant examples over the European cities. For example, he argued there are five key elements to reach Smart Growth. The five keys can be represented as 5C: community, connectivity, character, climate and collaboration. And he mentioned the meaning of the community with examples such as  ‘Schools as community hub with Houton, NL’ and ‘Places for all ages with Reiselfeld, Freiburg, Germany'.

Connected city, Five finger strategy and Redefining Greenbelt were mentioned as the future direction for smart growth in the UK as the conclusion of the lecture. In particular, he had expressed the negative feeling against current Greenbelt policy. According to him, the greenbelt of London is little bit old-fashioned and the greenbelt has been a strong obstacle to expand development areas and connecting between London and other cities. Although he said Redefining Greenbelt as one issue of the future direction, all three items should be accompanied with the reorganisation of London’s greenbelt. 

During his lecture, some questions were emerging by myself. Is really Green belt the obstruction of smart growth? Is there smart growth? If possible, how are different process and method needed compared to typical urban development? How can it work in high density?

I think there are two reasons why the questions were come up.
In the first, he emphasised the term of ‘smart’ and ‘smarter’ several times in his lecture. However, the term, smart, has been considering with the development of technology in our built-environment while his suggestions and examples were more familiar with sustainable urban planning and design.
Secondly, the key issues what he argued are too abstract and vague. We know community, connectivity, character, climate and collaboration are crucial factors. People might want to listen from him how we can achieve those factors, what kind of process, the roles of stakeholders and so on.

One of his lecutre slide. Image is taken by Networking City

There are good materials of urban design, field research and regional study on the homepage of URBED. They have run urban design and architectural design studios at University of Sheffield, so we can find the links of interesting students’ works. Also, they published ‘Sustainable Urban Neighbourhood’ in 2010 what includes some contents of today’s lecture.
 

Friday, 31 August 2012

Evelyn Grace Academy by Zaha Hadid Architects - Alternative way to consider the future of our school


Image is taken from Zaha Hadid Architects / The main entrance of Evelyn Grace Academy


Last September, during Open City event in London, Evelyn Grace Academy in Brixton was included in the list of the event and it was a nice opportunity to visit recent Zaha’s work. Hundreds of people came to the school and agreed it is an unusual architecture and special experience. After the visiting, it was thought that writing an article about Evelyn Grace Academy would be worth to understand new trend of education buildings in UK and Zaha’s approach for the type of architecture. Therefore, when Korean Institute of Educational Facilities asked to contribute an article about recent UK education building, it was easy to decide topic of the article.
Through the article, there are three main arguments to look deeply at Evelyn Grace Academy. Firstly, from the point of urban policy, this building should be understood as a flagship project in a devastated urban area and as an education led urban regeneration. ARK Schools, an education charity and the founder of the school, believes that education is an important method to cut the cycle of poverty. This charity supports to increase education quality in impoverished areas and has set up 11 schools in UK. Evelyn Grace Academy has been planned for not only a stunning shape of architecture in old affordable housing areas but also finding a possibility to overcome poverty and inequality in Brixton that had no secondary school.


Image by Networking City / Social housing in Brixton


Secondly, as considering the internal relationships, this school needs to be examined as a small society, furthermore, as a city. Although school (especially university) generally has been understood as a city because lots of students and staffs stay in, Evelyn Grace Academy which has four schools in the building is much more complex and complicate than other schools. Definitely, there should be more delicate considerations to make discreet management system and adequate collaboration between the schools from the early stage of the building design. As a result of the considerations, the corridors of this building, wider than normal school corridors, play a role like streets in small town by variation of visual effects, diverse volumes of internal space and good connection with internal and external space, and it leads more social activities of students.


Image by Networking City / Inside corridor of Evelyn Grace Academy


Image by Networking City / Spatial Experience in Evelyn Grace Academy


Lastly, Evelyn Grace Academy is a good example to show how architects fight against the common ideas of ‘school’, one of the most quantificational and standardized architectural type, within limited budget and area with keeping their design ideas and its final quality. There are many regulations and basic standards for the school building like suitable class size, noise and so on. The architects had have to consider how dynamic form and space make a cool relationship with standardized room size, basic class unit and needed clear functionality. Z shape of Evelyn Grace Academy, which is very unusual among school projects, was suggested for complex programs and effective using the site rather than Zaha’s design tendency. (Interview with Lars Teichmann, Project Architect) Architects generally do not want to make Z shape because it is hard to solve functional problems in the plan even though it is a private house. But in this project, Z shape of the building makes a clear distinctive point in contrast to other school projects and the herald symbol showing the change of the most deprived area in the UK.


Image is taken from Zaha Hadid Architects / Site circulation and Composition


Some people have a cynical view for Zaha’s works. I was one of them.
However, after visiting Evelyn Grace Academy, when her project is seen on website or magazine, the project attracts me more than before.